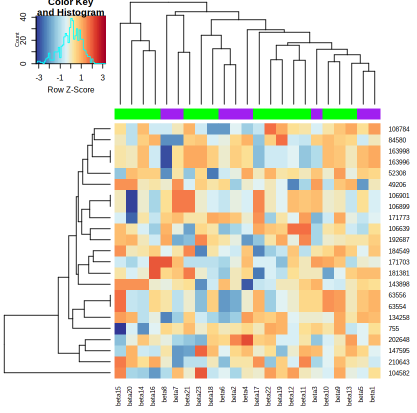
heatmap은 데이터 분석을 진행하다보면 scatter plot 만큼 접하기 쉬운 plot이다.
matrix값을 ploting 하고 Hierarchical clustering 까지 확인할 수 있기때문에 인기가 많다.
오늘은 R로 heatmap그리는 법을 간단하게 알아보겠다.
library(gplots)
library(RColorBrewer)
우선 위의 라이브러리를 설치하고 import 한다.
input table은 아래와같이 numeric matrix로 이루어져있어야한다.

1. 기본적인 코드
mypalette <- brewer.pal(10,"RdYlBu")
morecols <- colorRampPalette(mypalette)

heatmap.2(as.matrix(df),col=rev(morecols(50)),trace="none")
실행결과

2. 그룹 지정후 컬러바 추가 코드
col.cell <- c("green","purple")[as.factor(c(1,1,1,1,1,1,1,1,0,0,0,0,0,0,0,0,0,0,0,0,0,0,0))]
mypalette <- brewer.pal(10,"RdYlBu")
morecols <- colorRampPalette(mypalette)

heatmap.2(as.matrix(df),col=rev(morecols(50)),trace="none",ColSideColors=col.cell)
실행결과

3. row기준으로 scale조정
col.cell <- c("green","purple")[as.factor(c(1,1,1,1,1,1,1,1,0,0,0,0,0,0,0,0,0,0,0,0,0,0,0))]
mypalette <- brewer.pal(10,"RdYlBu")
morecols <- colorRampPalette(mypalette)
heatmap.2(as.matrix(df),col=rev(morecols(50)),trace="none",ColSideColors=col.cell, scale="row")
실행 결과

4. heatmap 그린 후 저장까지 하기
png(file="saving_image.png",width=800, height=700)

col.cell <- c("green","purple")[as.factor(c(1,1,1,1,1,1,1,1,0,0,0,0,0,0,0,0,0,0,0,0,0,0,0))]
mypalette <- brewer.pal(10,"RdYlBu")
morecols <- colorRampPalette(mypalette)

heatmap.2(as.matrix(df),col=rev(morecols(50)),trace="none",ColSideColors=col.cell)
## 그룹바에대한 legend box 추가하는 code
legend("topright",legend = c("C","N"), col =unique(col.cell), lty= 1,lwd = 5,cex=.7)

dev.off()
실행결과

끝!!
반응형
'Statistics > R' 카테고리의 다른 글
| [에러해결]cannot rescale a constant/zero column to unit variance prcomp in R (0) | 2021.11.16 |
|---|---|
| R - CI(confidence Interval)구하기 (0) | 2020.11.13 |